Does April 20th Cause More Fatal Car Crashes?
2025
traffic safety
statistics
Background
In 2018, Staples and Redelmeier published a study in JAMA Internal Medicine claiming that April 20th — widely associated with cannabis celebration — sees a significant increase in fatal traffic accidents in the United States. Analysing crashes between 4:20 PM and midnight using data from the Fatality Analysis Reporting System (FARS), they reported a 12% increase in crash risk on 4/20 compared to control dates one week before and after (April 13th and April 27th).
This finding attracted considerable attention, but also scrutiny. In 2019, Harper and Palayew revisited the question in BMJ Injury Prevention, using more robust methods, a broader set of control dates, and a more comprehensive time window. Crucially, they also compared the supposed 4/20 effect against those for other major US holidays. They could not replicate the signal for April 20th, though they did find genuine increases for holidays such as July 4th. Their work highlighted how analytical choices — control date selection, time windows, and statistical methods — can produce or eliminate apparent effects.
This report revisits the question using the same FARS-derived dataset from TidyTuesday. We focus on the 4:20 PM to midnight time window and compare April 20th to control dates one week before and after (April 13th and April 27th).
Data Overview
The daily_accidents_420_time dataset counts fatal traffic accidents during the 4:20 PM to midnight window for every day from 1992 to 2016. This matches the time window used in the original Staples & Redelmeier study.
Following their design, we compare April 20th to control dates one week before and after (April 13th and April 27th), yielding 25 April 20th observations and 50 control observations.
| Metric | Value |
|---|---|
| Time window | 4:20 PM – midnight |
| Date range | 1992–2016 |
| April 20th observations | 25 |
| Control date observations | 50 |
Visual Exploration
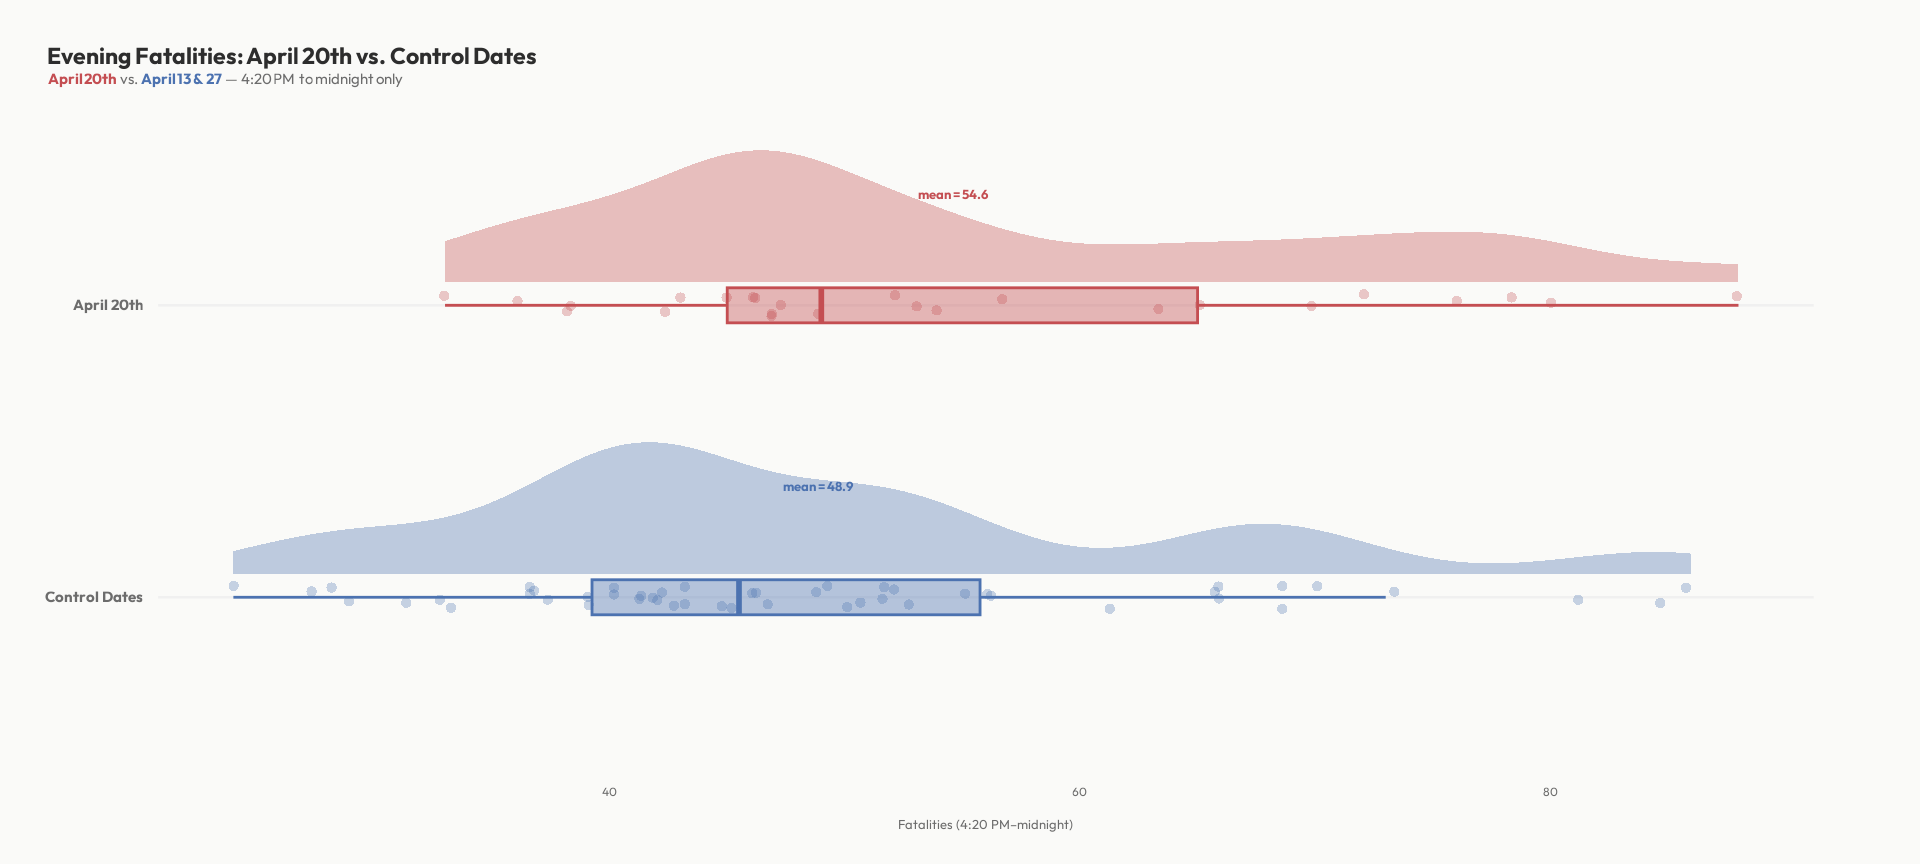
The 4:20 PM–Midnight Window: 4/20 vs. Control Dates
| Group | Mean | Median | SD | N |
|---|---|---|---|---|
| Control Dates | 48.9 | 45.5 | 14.9 | 50 |
| April 20th | 54.6 | 49.0 | 15.3 | 25 |
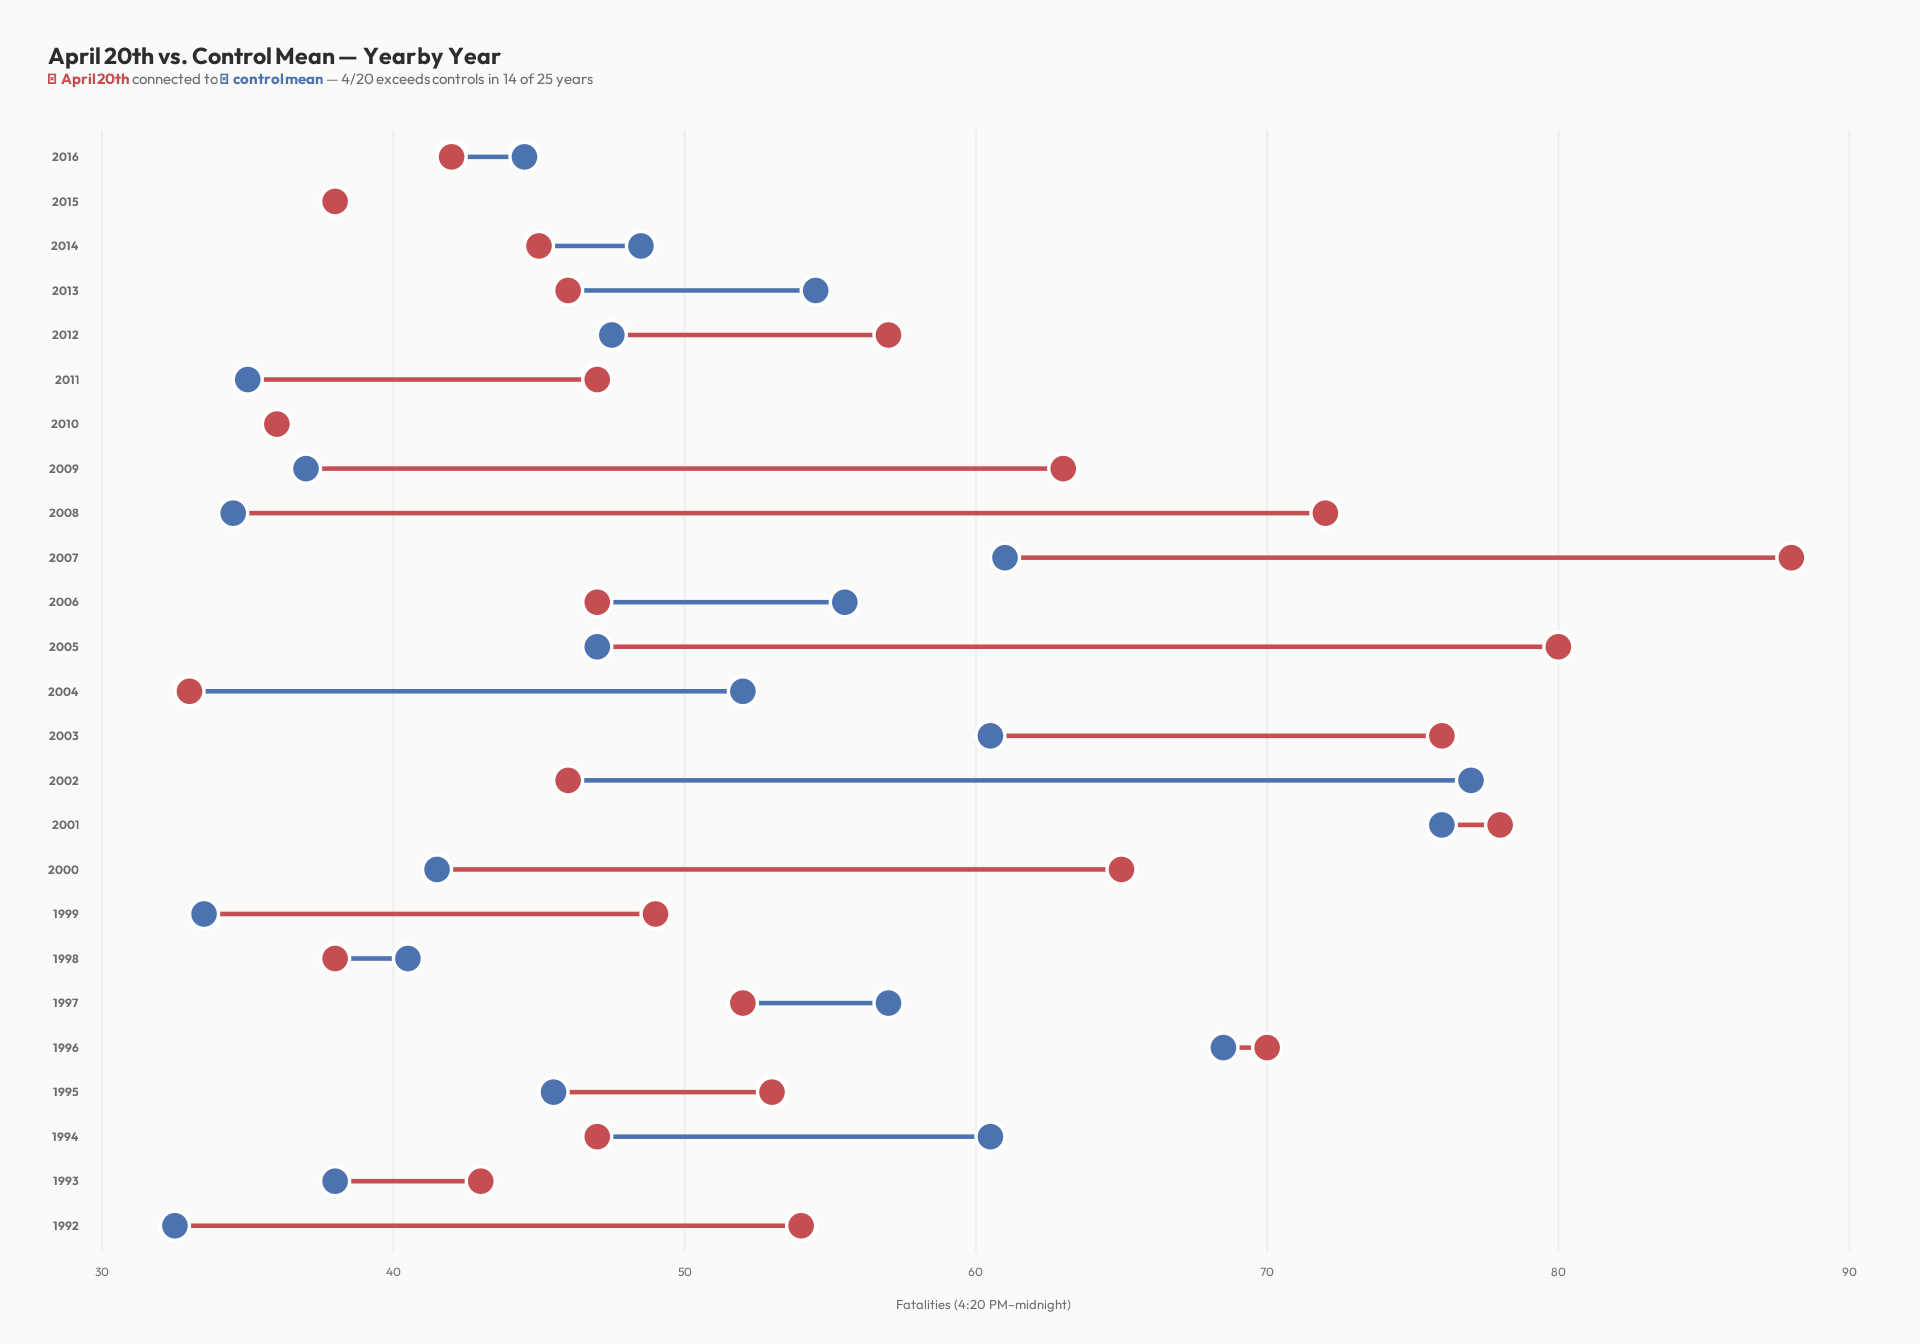
Year-by-Year Comparison
How does April 20th’s evening window compare to its control dates within each year? This dumbbell view controls for the secular trend.
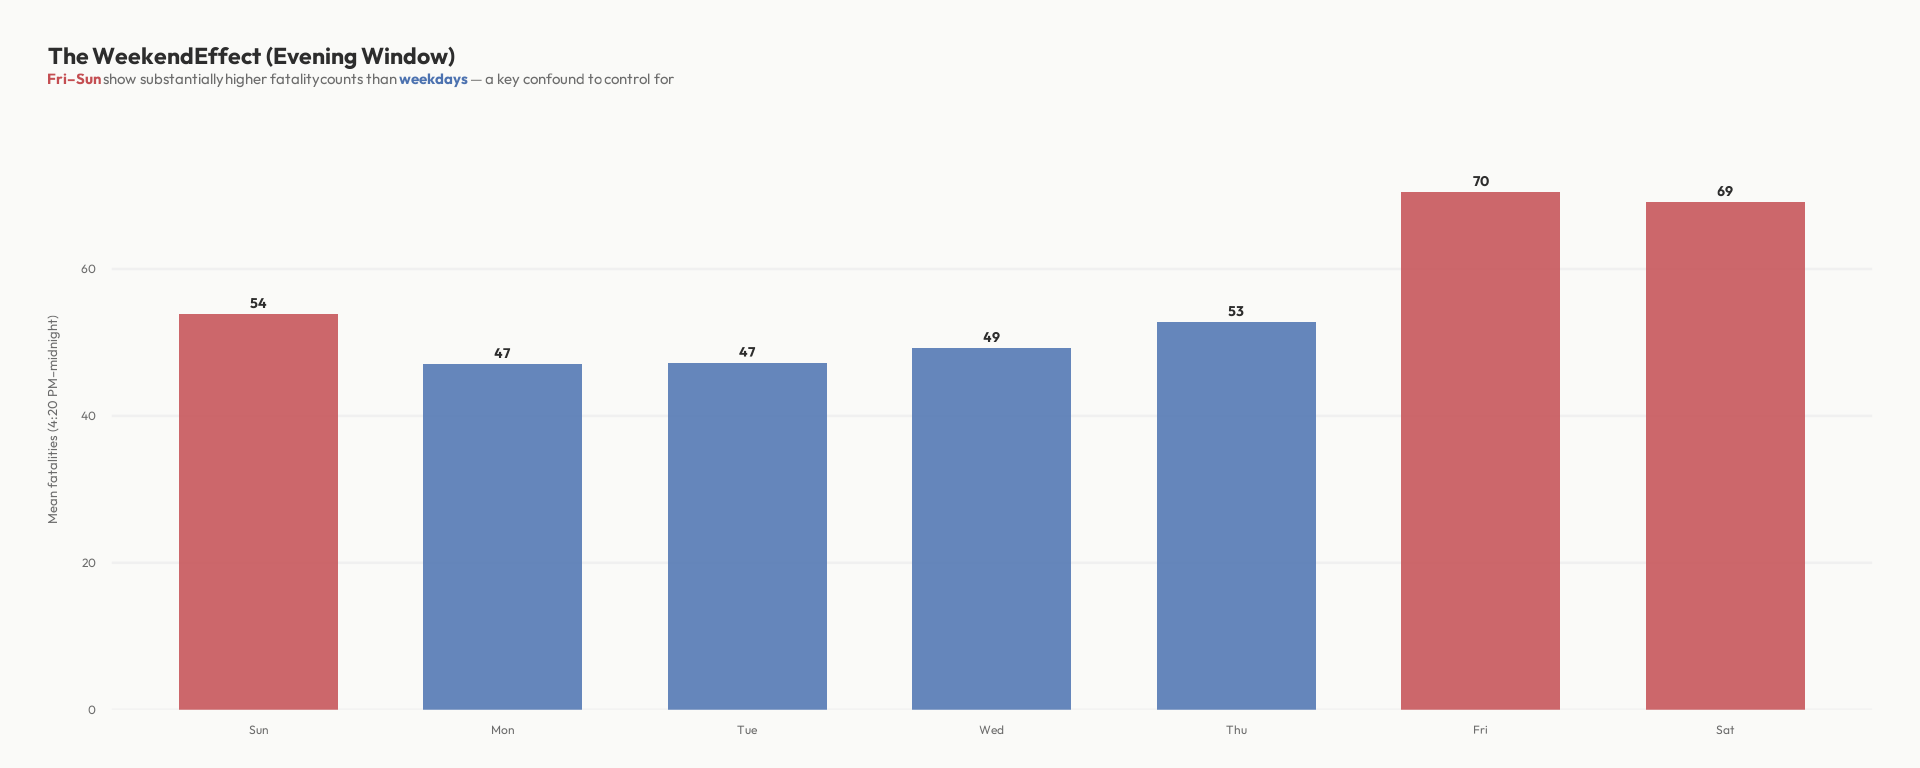
Day-of-Week Patterns
Traffic fatalities follow strong weekly cycles — weekends are deadlier. If April 20th disproportionately falls on certain weekdays, this could confound the comparison.
Statistical Analysis
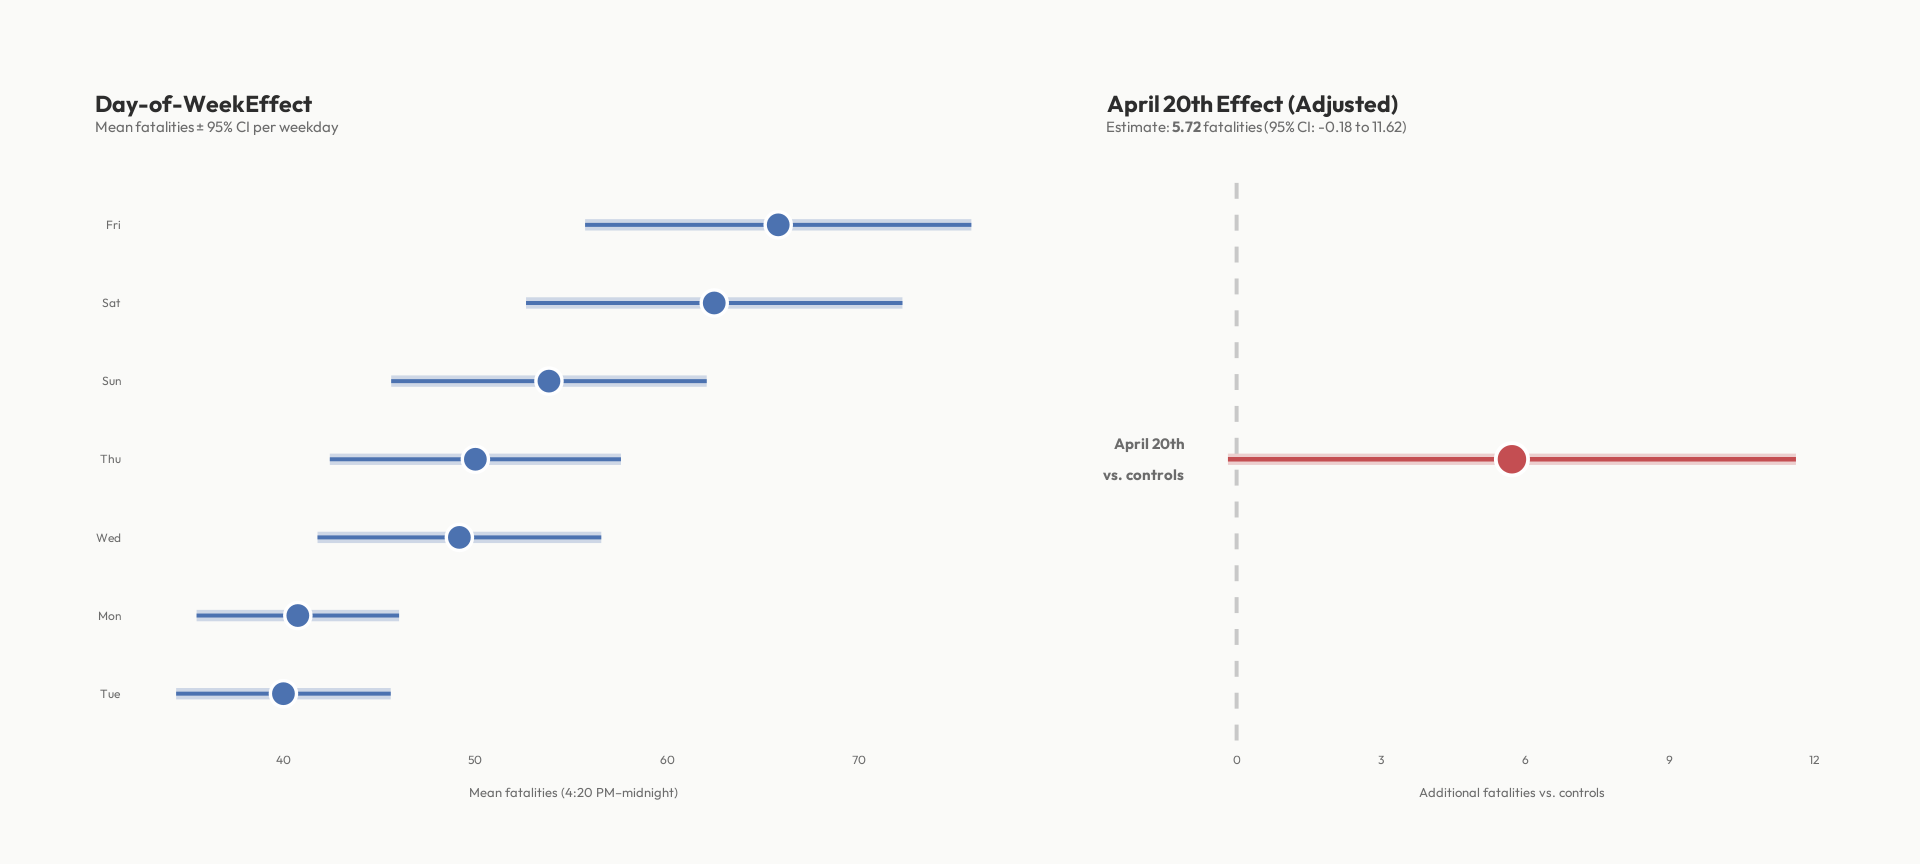
Model: Controlling for Year and Day of Week
A simple comparison of means can be misleading if April 20th dates differ systematically from controls in their day-of-week distribution. The linear model below estimates the 4/20 effect while adjusting for both year and day of week.
| Term | Estimate | SE | CI Low | CI High | p |
|---|---|---|---|---|---|
| (Intercept) | 1043.18 | 406.42 | 231.73 | 1854.63 | 0.01 |
| is_420TRUE | 5.72 | 2.95 | -0.18 | 11.62 | 0.06 |
| year | -0.50 | 0.20 | -0.90 | -0.09 | 0.02 |
| wday.L | 16.20 | 3.76 | 8.69 | 23.71 | 0.00 |
| wday.Q | 13.29 | 3.72 | 5.86 | 20.72 | 0.00 |
| wday.C | -11.56 | 3.77 | -19.09 | -4.03 | 0.00 |
| wday^4 | -1.07 | 3.70 | -8.45 | 6.31 | 0.77 |
| wday^5 | -5.63 | 3.79 | -13.19 | 1.93 | 0.14 |
| wday^6 | -7.66 | 3.78 | -15.21 | -0.10 | 0.05 |
Key result: The estimated effect of April 20th is 5.72 fatalities in the evening window compared to control dates (95% CI: -0.18 to 11.62, p = 0.06). The model explains 43.6% of variance.
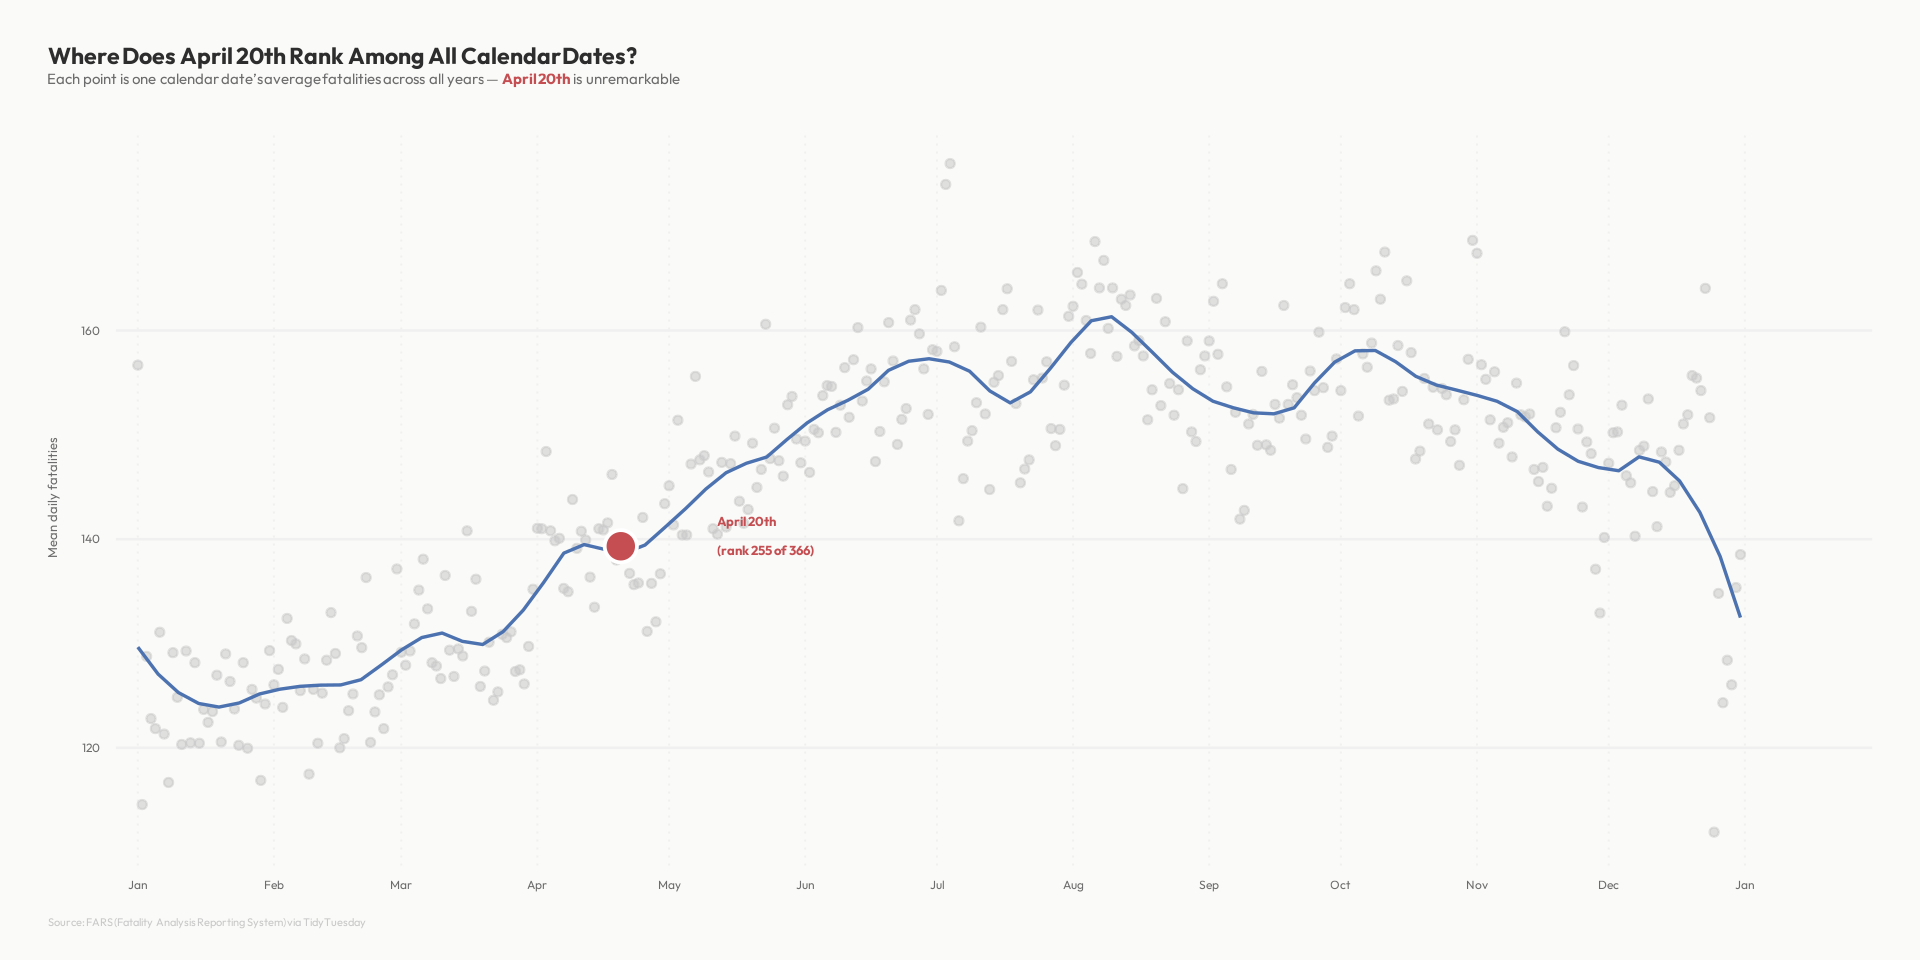
Zooming Out: All Calendar Dates
Does April 20th stand out among all calendar dates when we look at total daily fatalities?
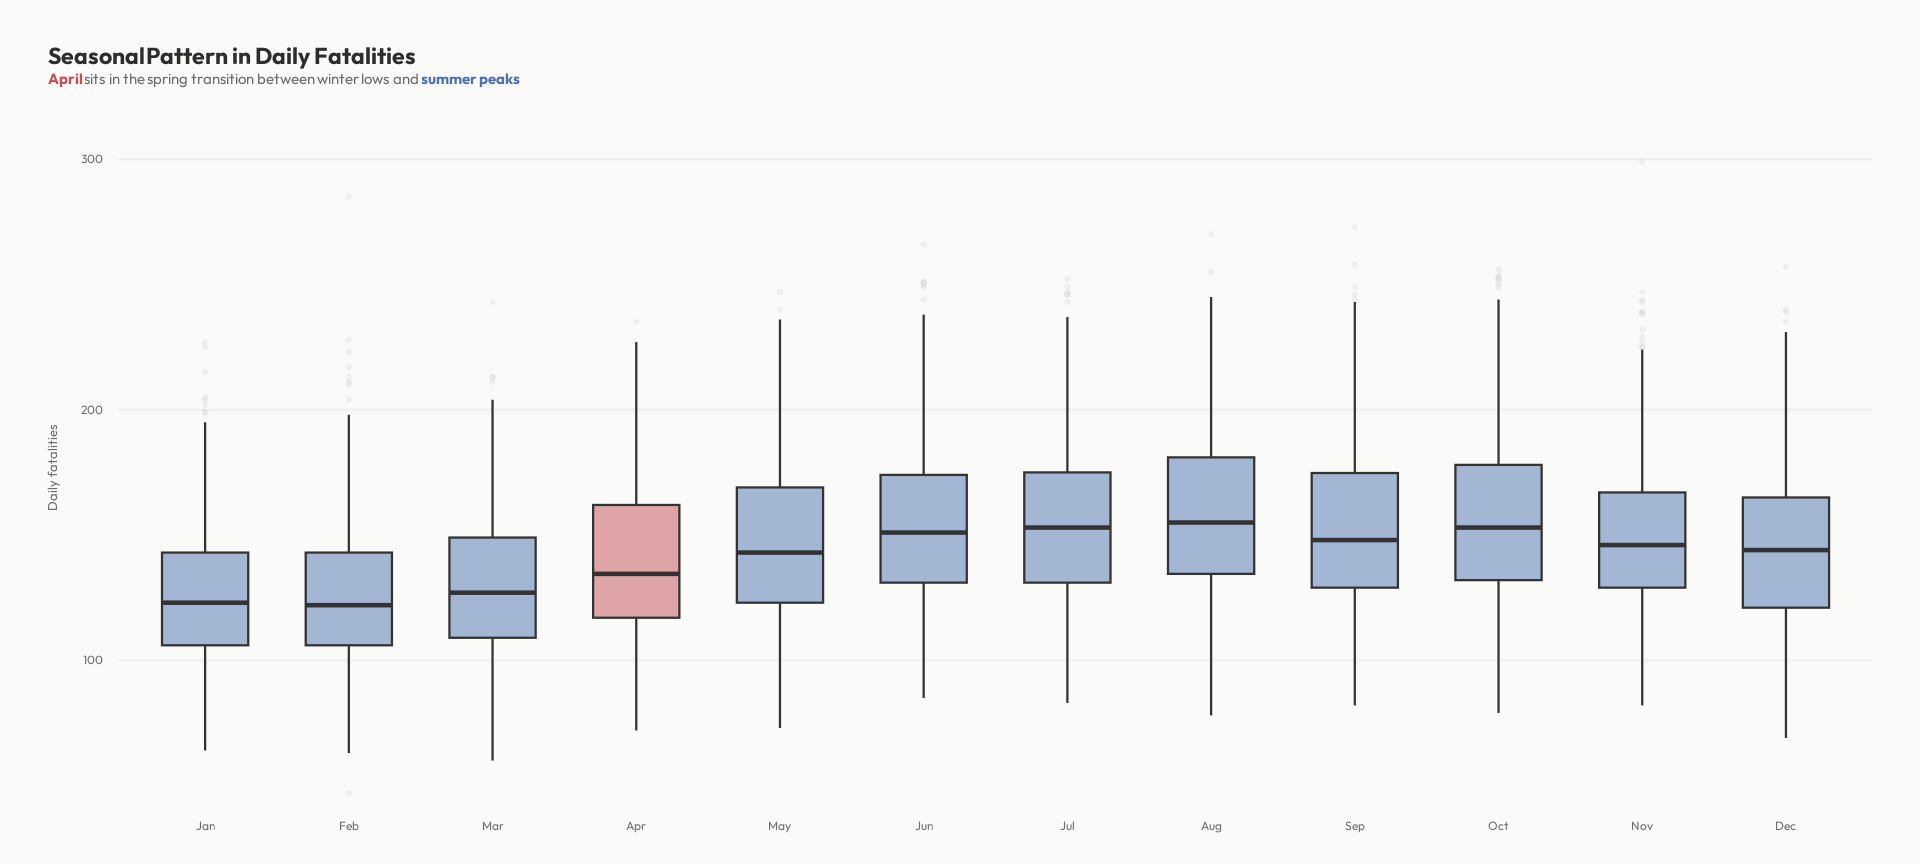
Seasonal Context
Conclusion
After controlling for year trends and day-of-week effects, the estimated 4/20 effect in the evening window is 5.72 fatalities (p = 0.06), which is not statistically significant at the conventional 0.05 threshold. The confidence interval spans from -0.18 to 11.62. This is consistent with Harper & Palayew’s conclusion that the original Staples & Redelmeier finding does not hold up under more robust analysis.
Several caveats are worth noting:
- Small sample: With only 25 April 20th observations, statistical power is limited.
- Control date selection matters: The original Staples & Redelmeier study’s choice of control dates (one week before/after) has been debated. Different control strategies can shift the result — a key point Harper & Palayew demonstrated.
- Correlation vs. causation: Even a significant association would not prove that cannabis use caused additional crashes — other April 20th-specific factors could contribute.
- This is a lesson in analytical choices: As the TidyTuesday curators note, this dataset is “a great example of how charts can mislead based on choices in analysis and plotting.”
The question of whether 4/20 poses a genuine traffic safety risk appears to be resolved: the effect claimed by Staples & Redelmeier does not survive more careful analysis. The day-of-week effect dwarfs any plausible April 20th signal, and the date is unremarkable when viewed among all calendar dates.