The Relative Age Effect in NHL Hockey
2024
sports
statistics
Introduction
Are NHL players more likely to be born in certain months? Youth hockey in Canada and many other countries uses January 1 as the age cutoff for divisions. This means a child born in January plays against children born up to 11 months later — giving them a significant size and developmental advantage at young ages. This early advantage snowballs into more ice time, better coaching, and ultimately a higher chance of going pro. This phenomenon is known as the relative age effect and was famously discussed in Malcolm Gladwell’s Outliers.
Let’s see if the data backs this up.
The Relative Age Effect: Birth Month Distribution
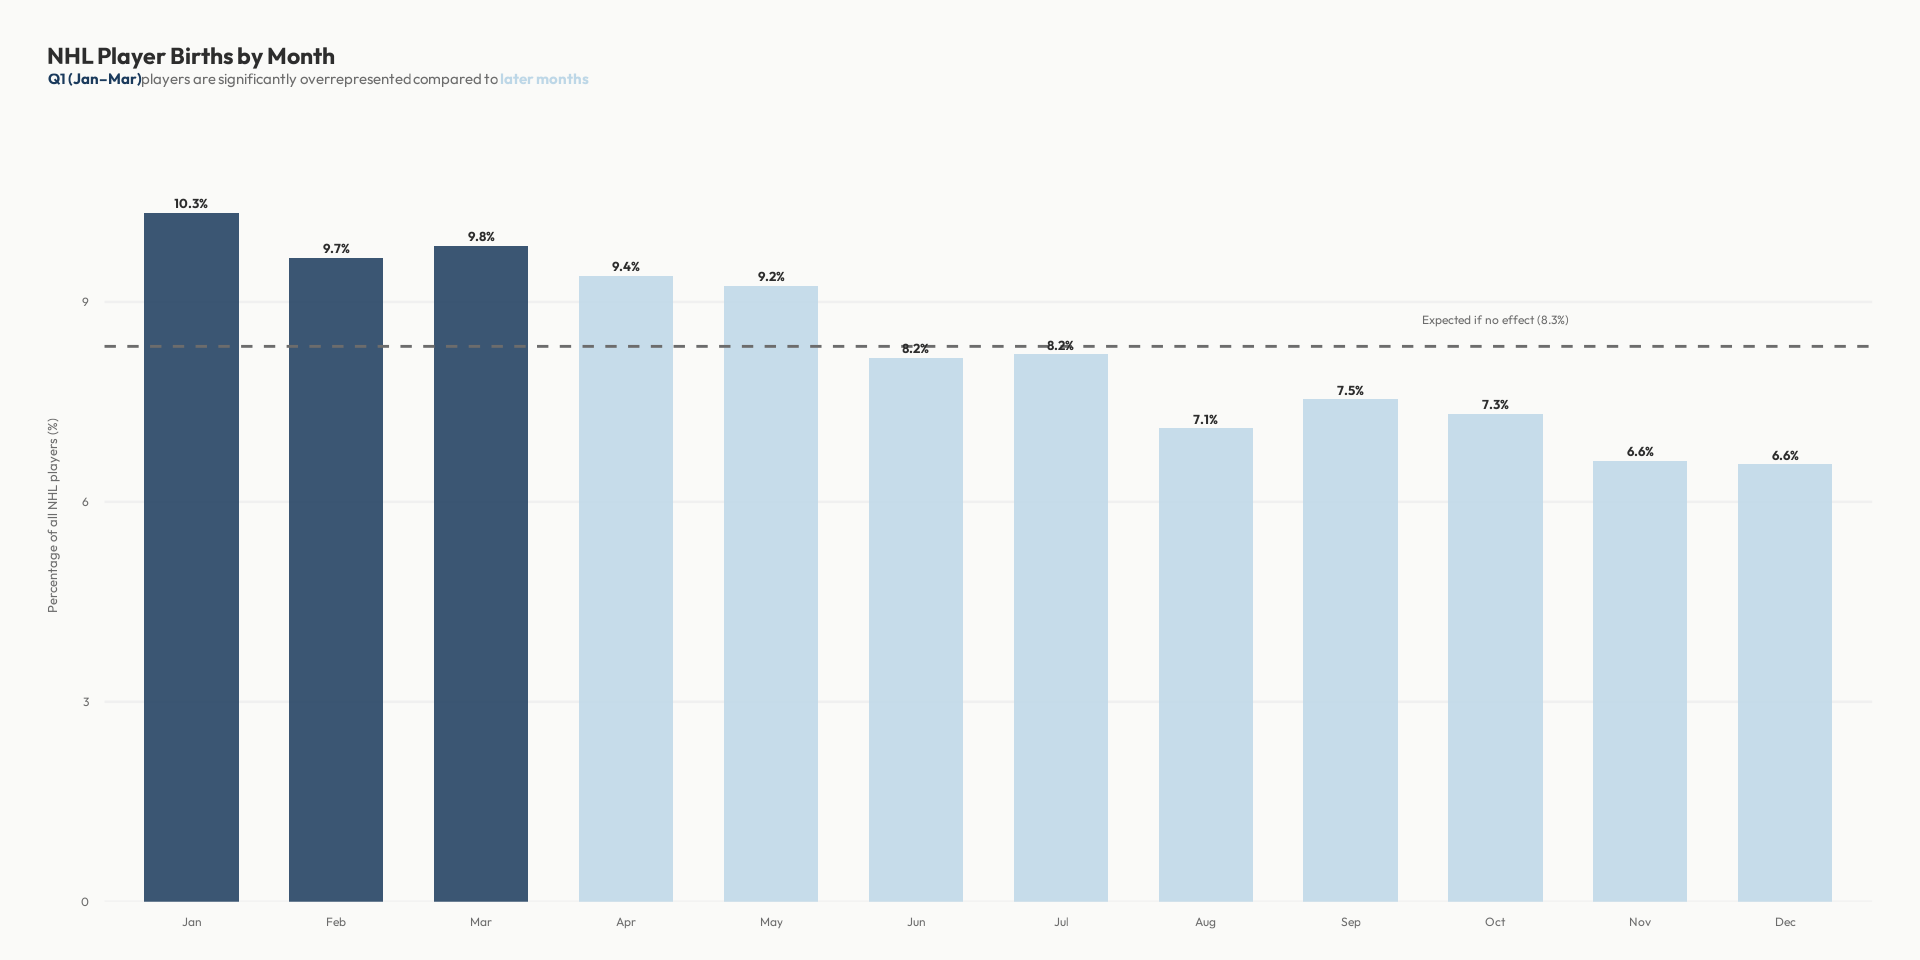
If birth month didn’t matter, we’d expect roughly equal numbers of NHL players born in each month (~8.3% each). Let’s see the actual distribution.
Quarterly Breakdown
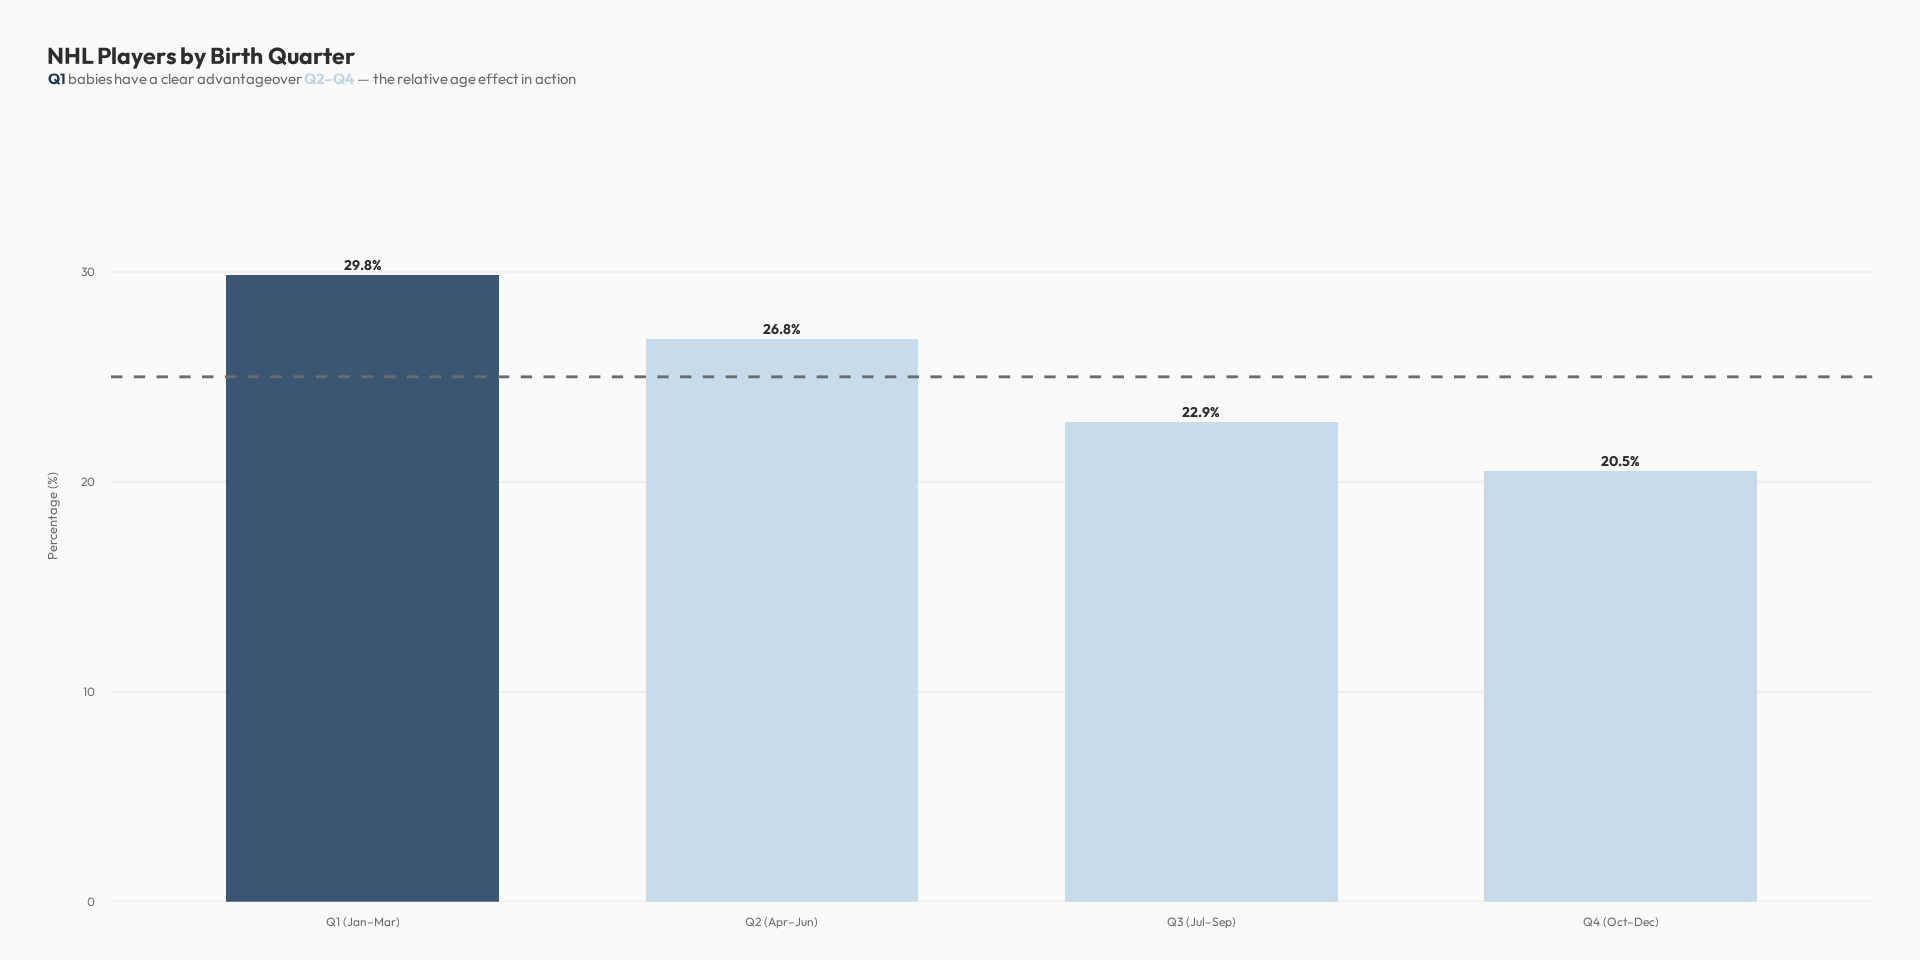
Grouping by quarter makes the effect even more striking.
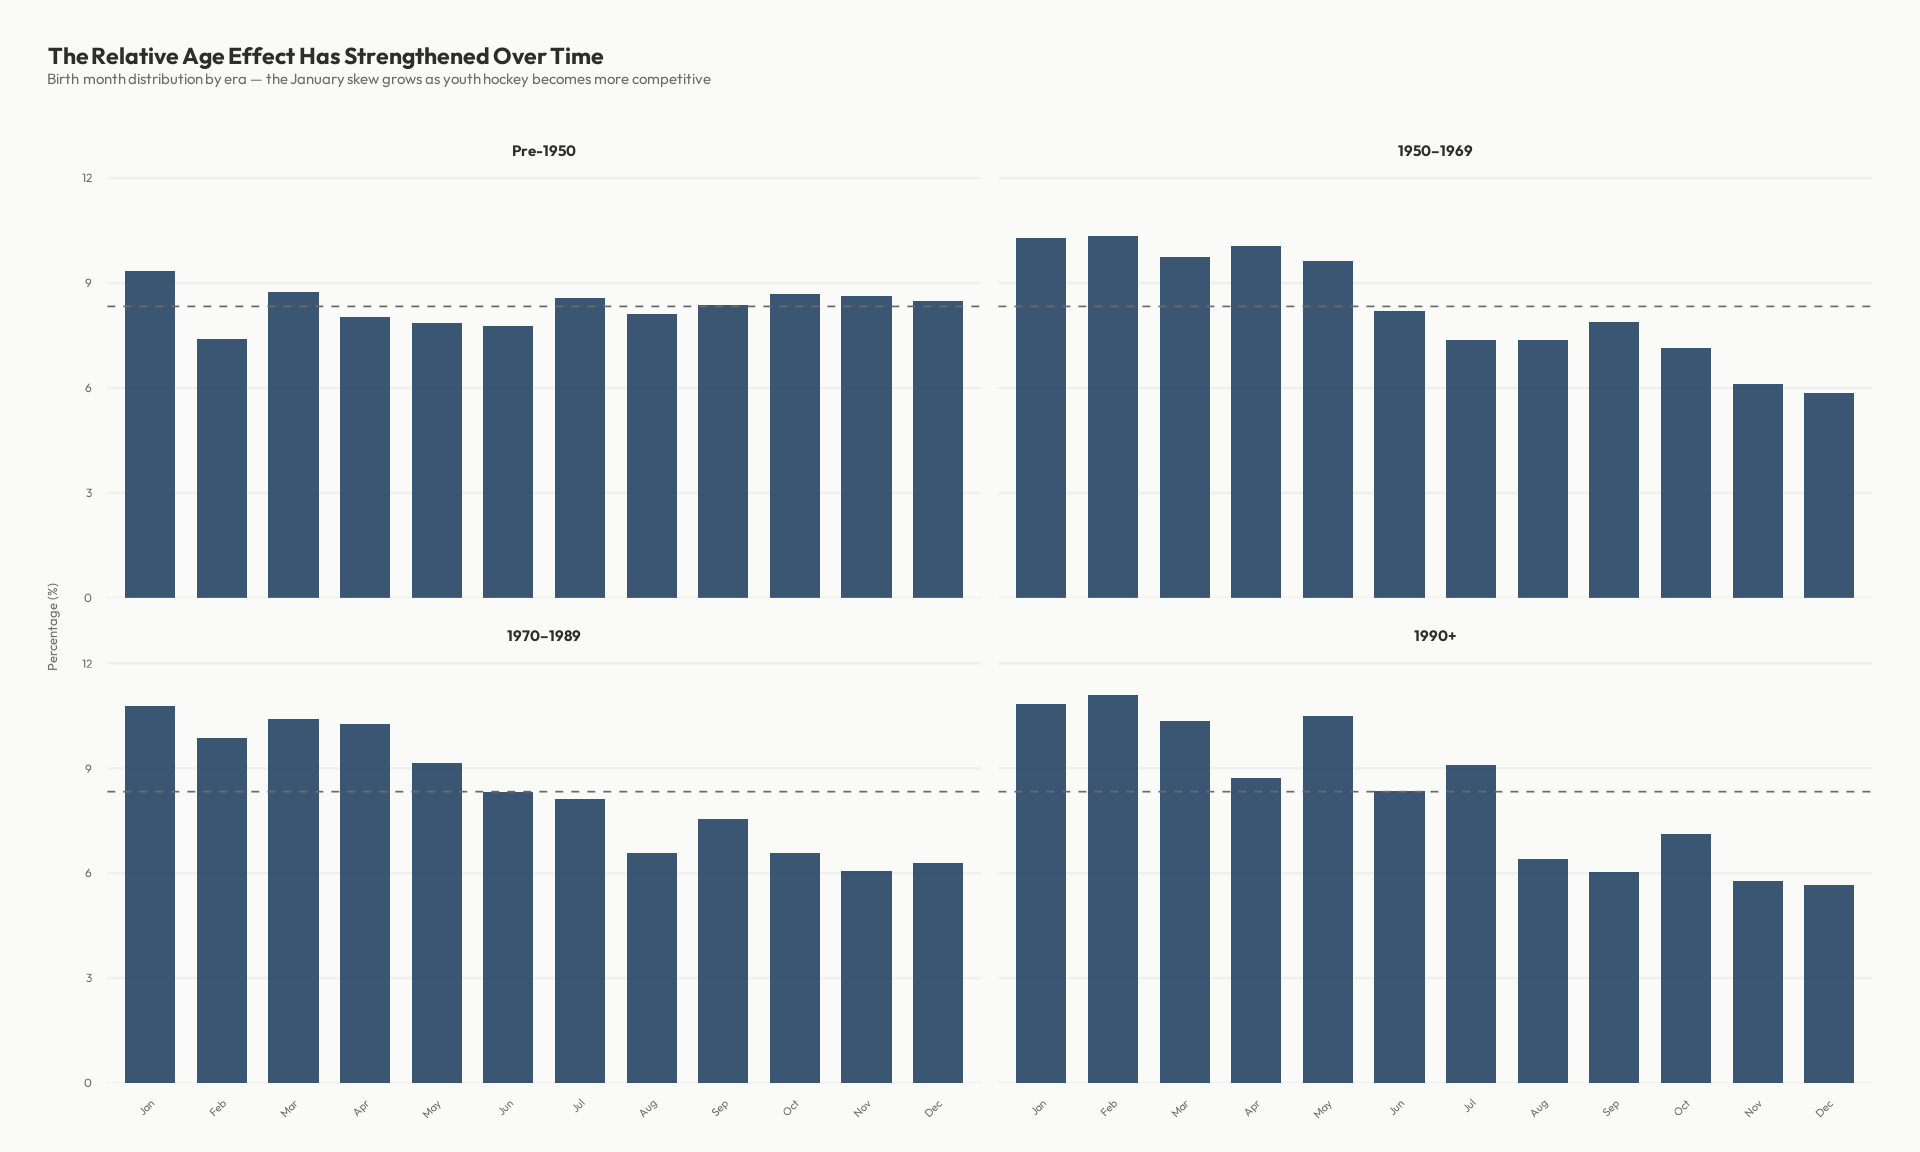
Has the Effect Changed Over Time?
As awareness of this bias has grown, has it diminished in recent decades?
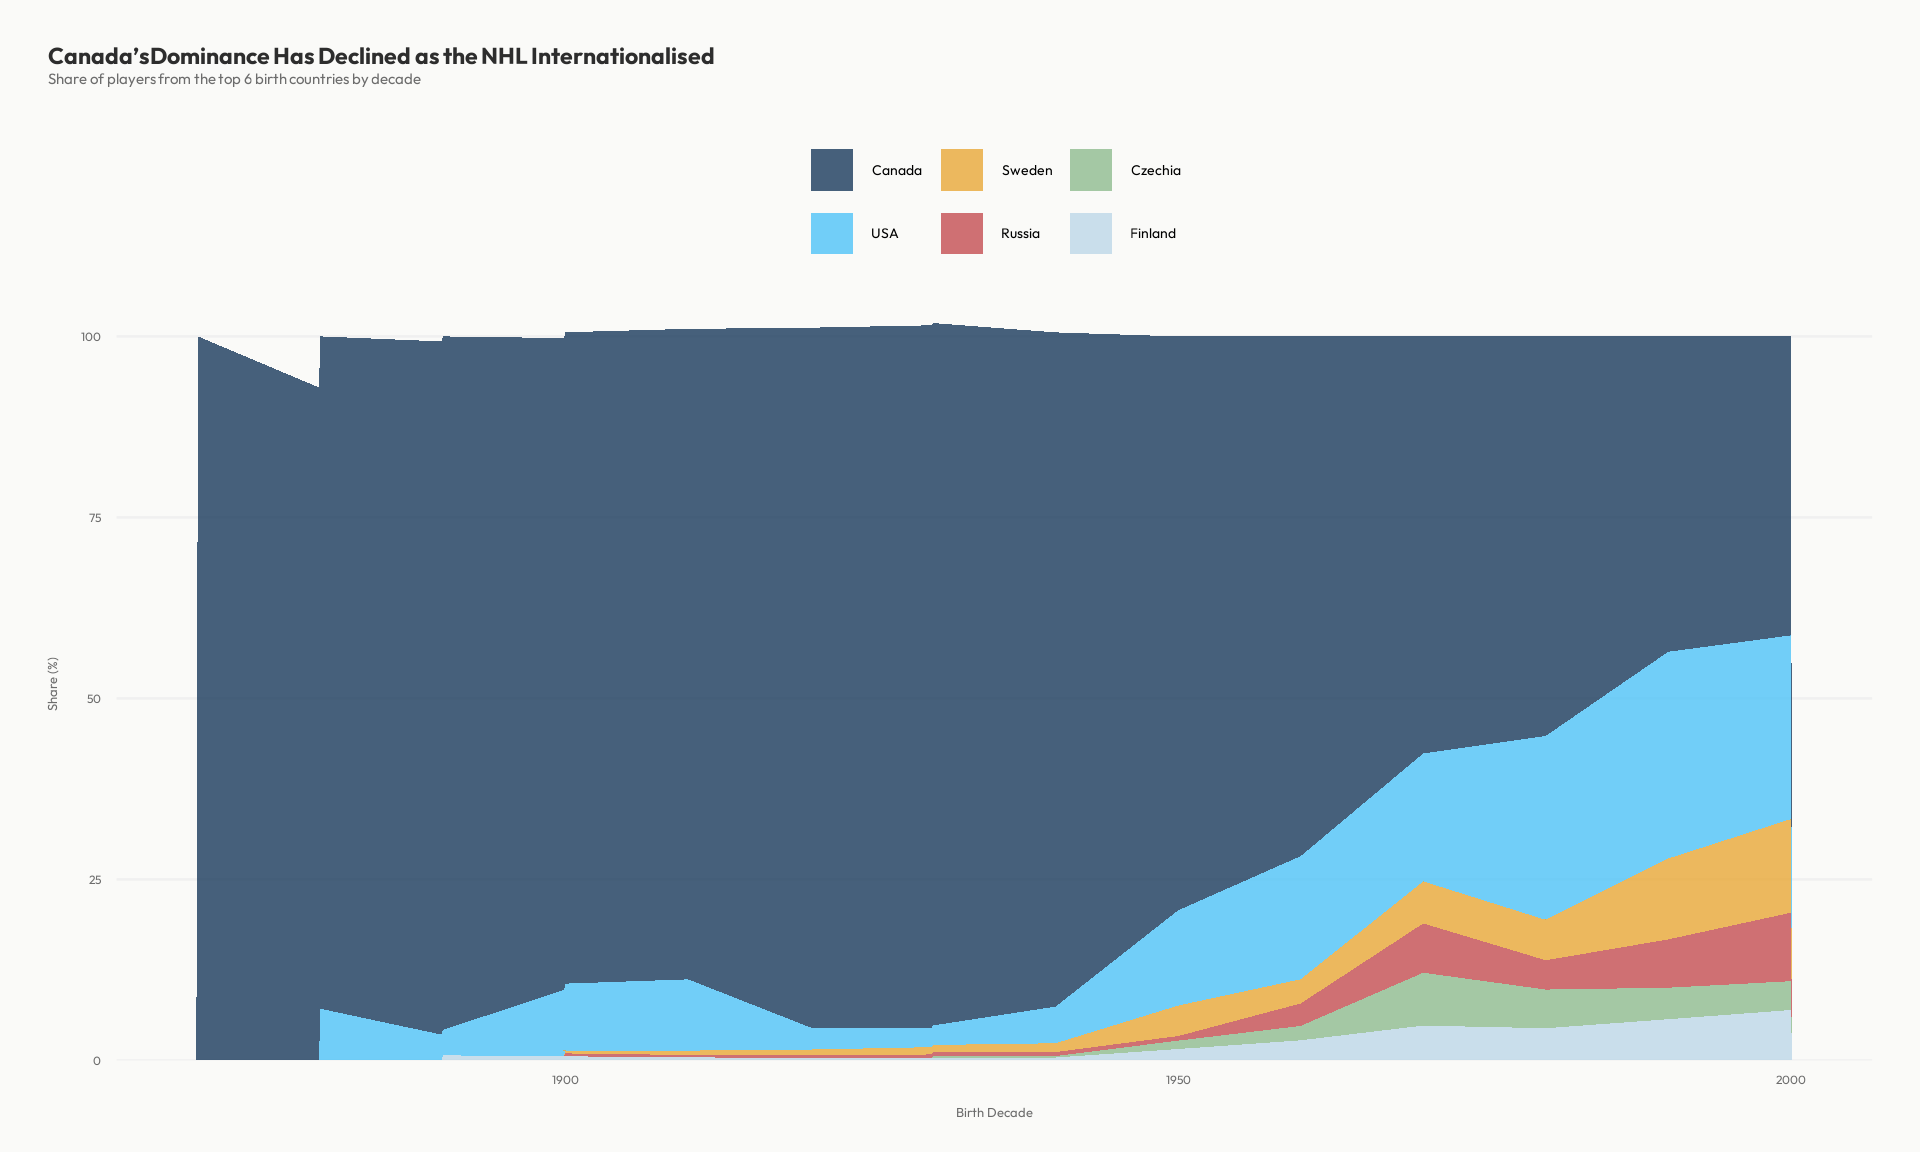
Birth Country Trends
How has the geographic makeup of the NHL changed over time?
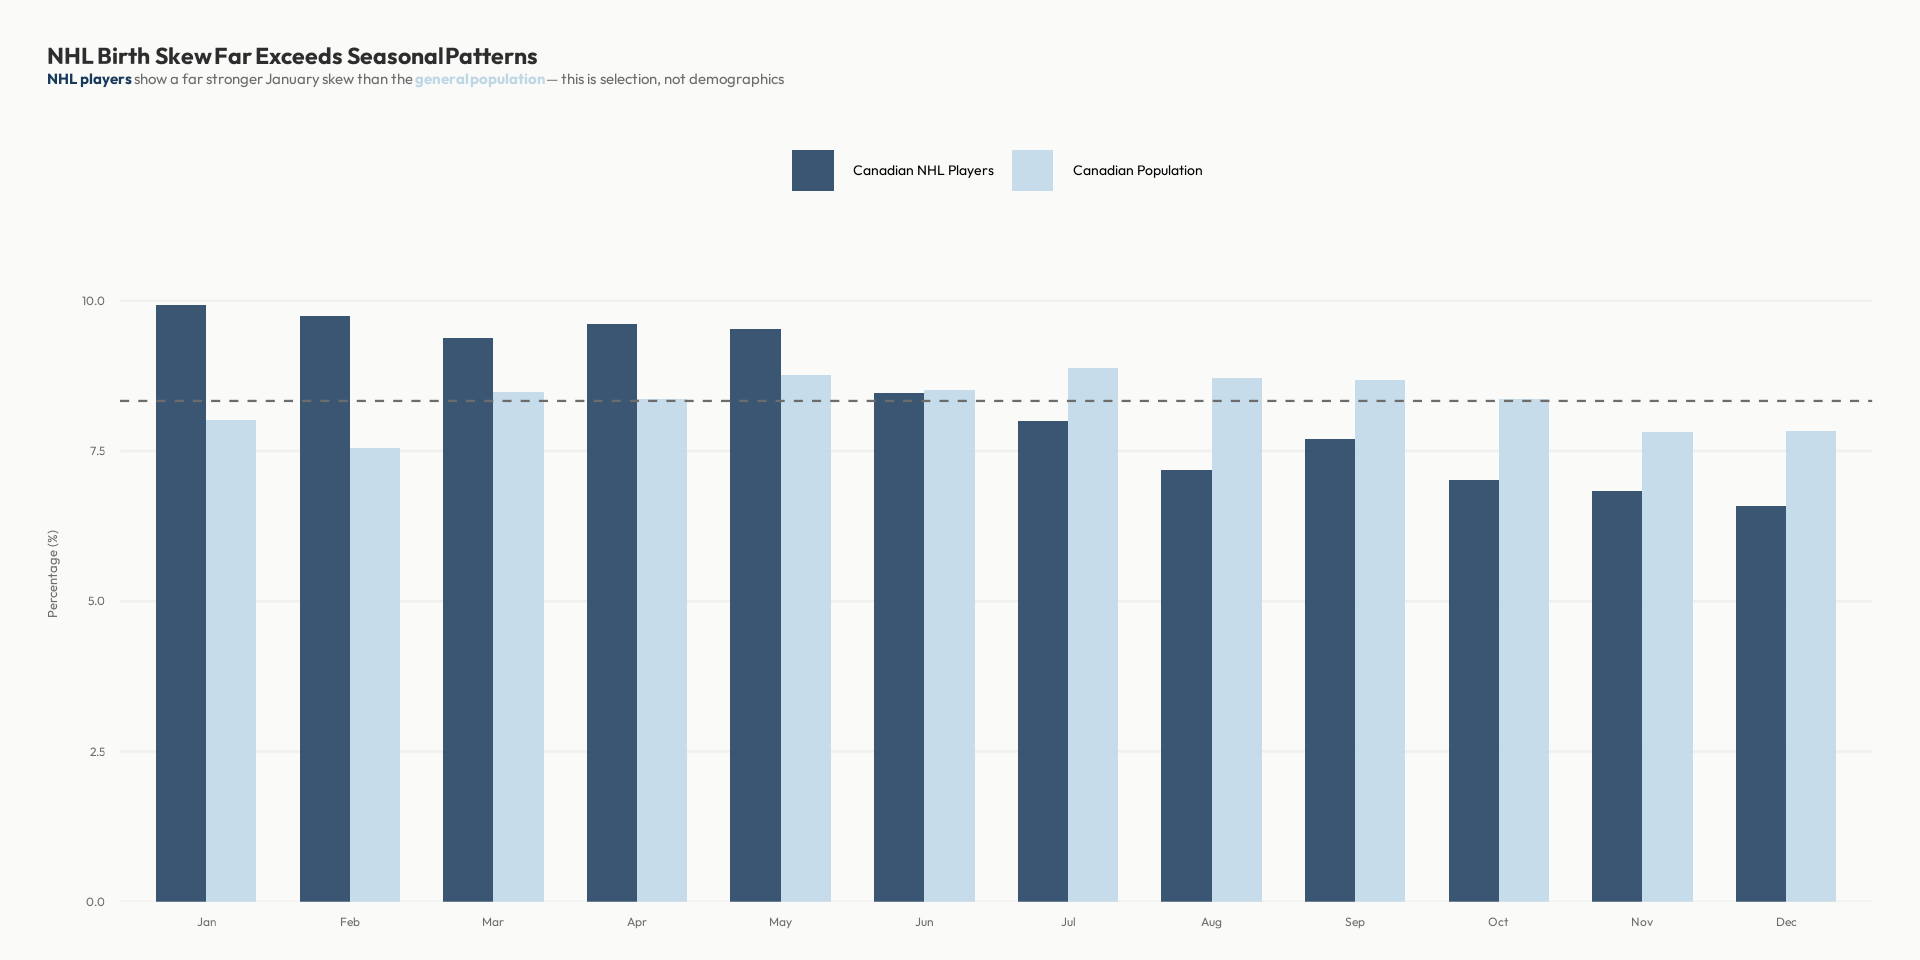
Canadian Births vs. NHL Player Births
We can compare the general Canadian birth pattern to the NHL player birth pattern to see whether the NHL skew is truly beyond what normal seasonality would explain.
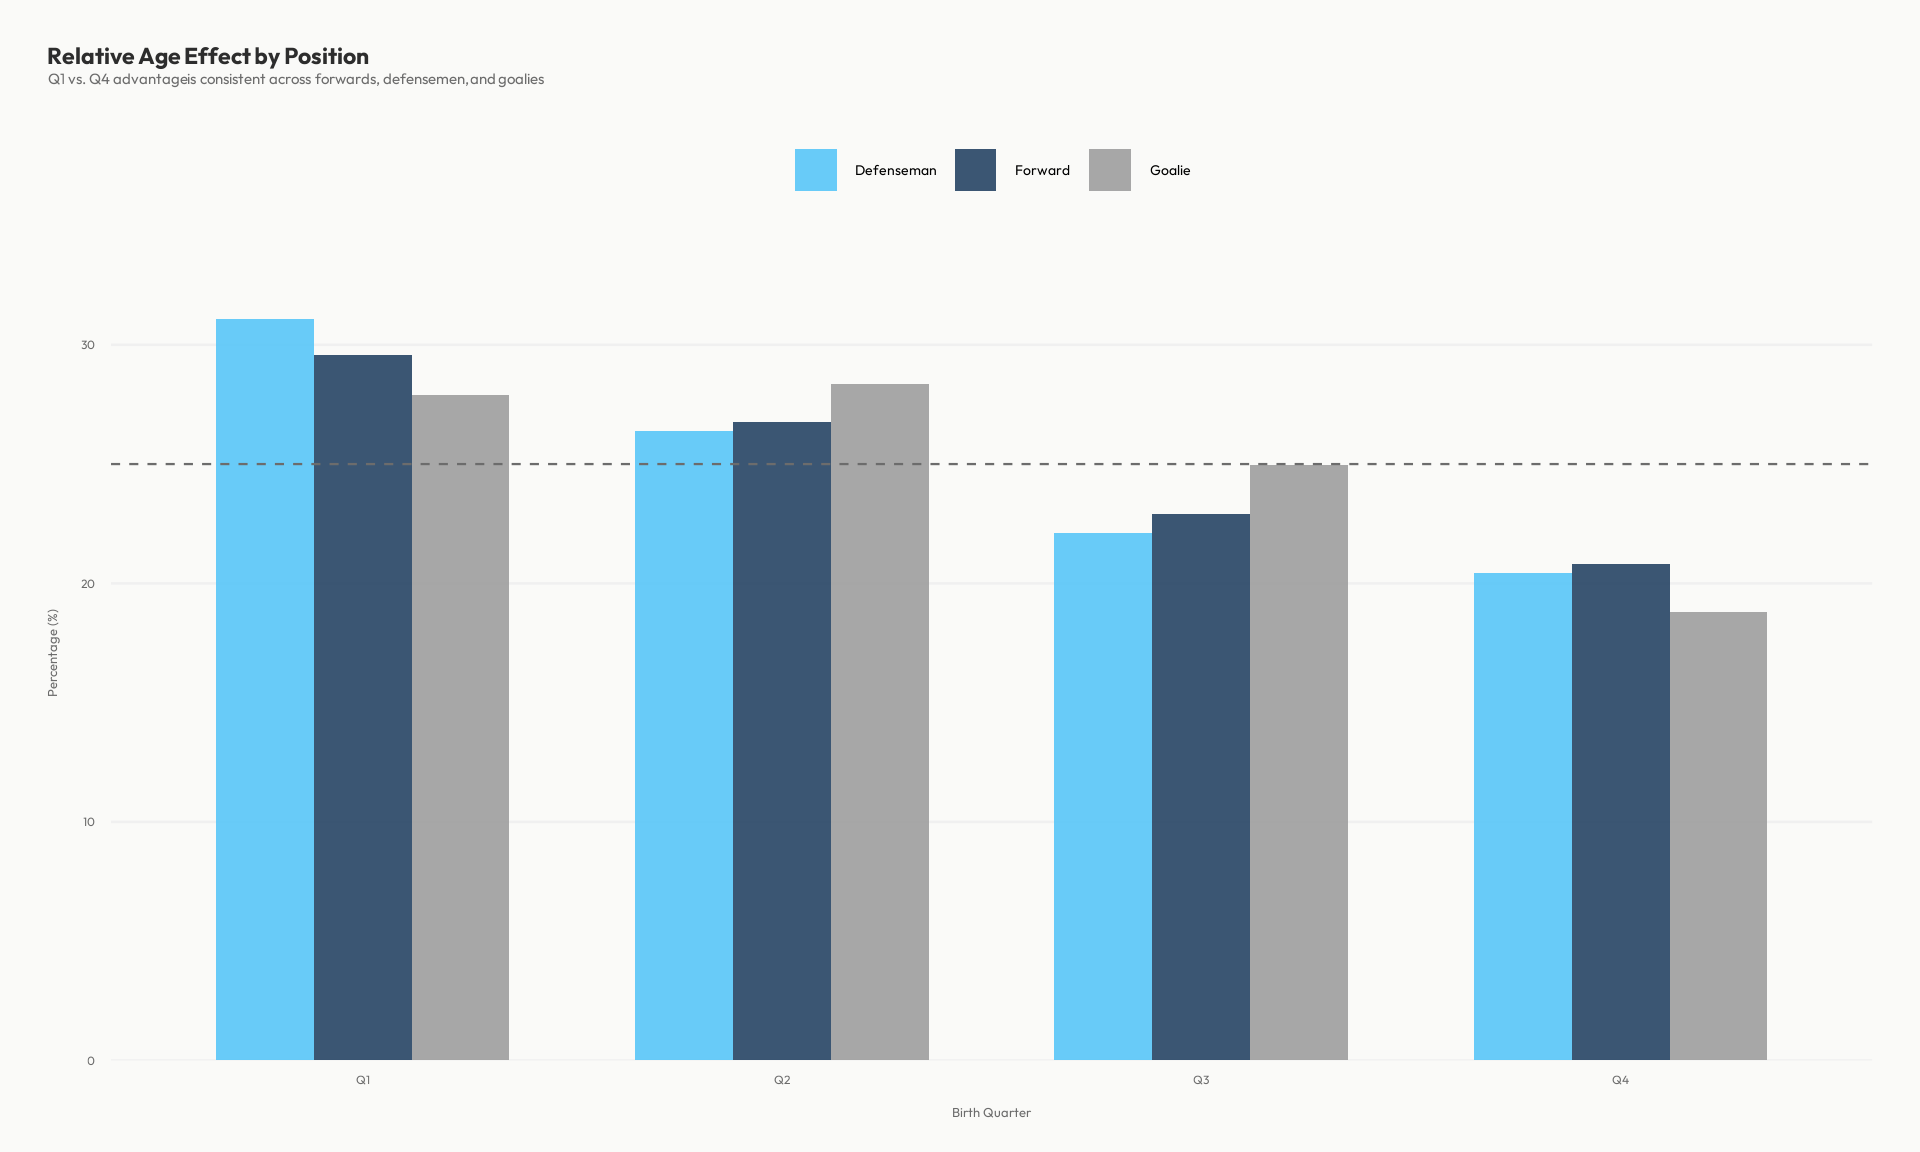
Player Positions and the Relative Age Effect
Does the effect vary by position? Larger positions (defensemen) might show a stronger effect than skill positions (forwards).
Conclusion
The data clearly shows the relative age effect in the NHL:
- Players born in Q1 (Jan–Mar) are significantly overrepresented compared to those born in Q4 (Oct–Dec).
- The effect has persisted and even strengthened as youth hockey became more competitive and structured.
- The NHL skew far exceeds normal seasonal birth patterns in the Canadian population, confirming this is a selection effect, not a demographic one.
- The effect is present across all positions.
This is a systemic bias baked into how youth sports are organized. Some leagues have experimented with alternative cutoff dates or birth-year groupings to mitigate it — but for now, being born in January remains a quiet advantage on the road to the NHL.